What’s under the hood?

Telemetry: a big opportunity to approach scaling in the cloud – Part 1

10 minute read
Telemetry: a big opportunity to approach scaling in the cloud – Part 1

Image by Emma Gossett – Unsplash

by AI Insider team

What’s under the hood? What flavors of scalability to consider in the cloud? How to find the right process to extract for scaling using telemetry?


This article is part one of a two-part series on using telemetry to approach scaling in the cloud.

Context

The topic of scalability has been evolving very fast in the last 10 years. Understandable if one could get lost in tons of SDKs, tools, and product announcements. In this two-part article, we invite you to learn more on how to approach scalability and, at the end, we give you the direction on how to move forward. We consider a need in scaling and how to use telemetry to analyze it.

While the topic of microservices is tightly bound to the scalability, our consideration should work for SOA-like systems (Fig. 1) as well as monolith and various combinations.

Fig. 1. SOA - Service Oriented Architecture adapted from Wikipedia
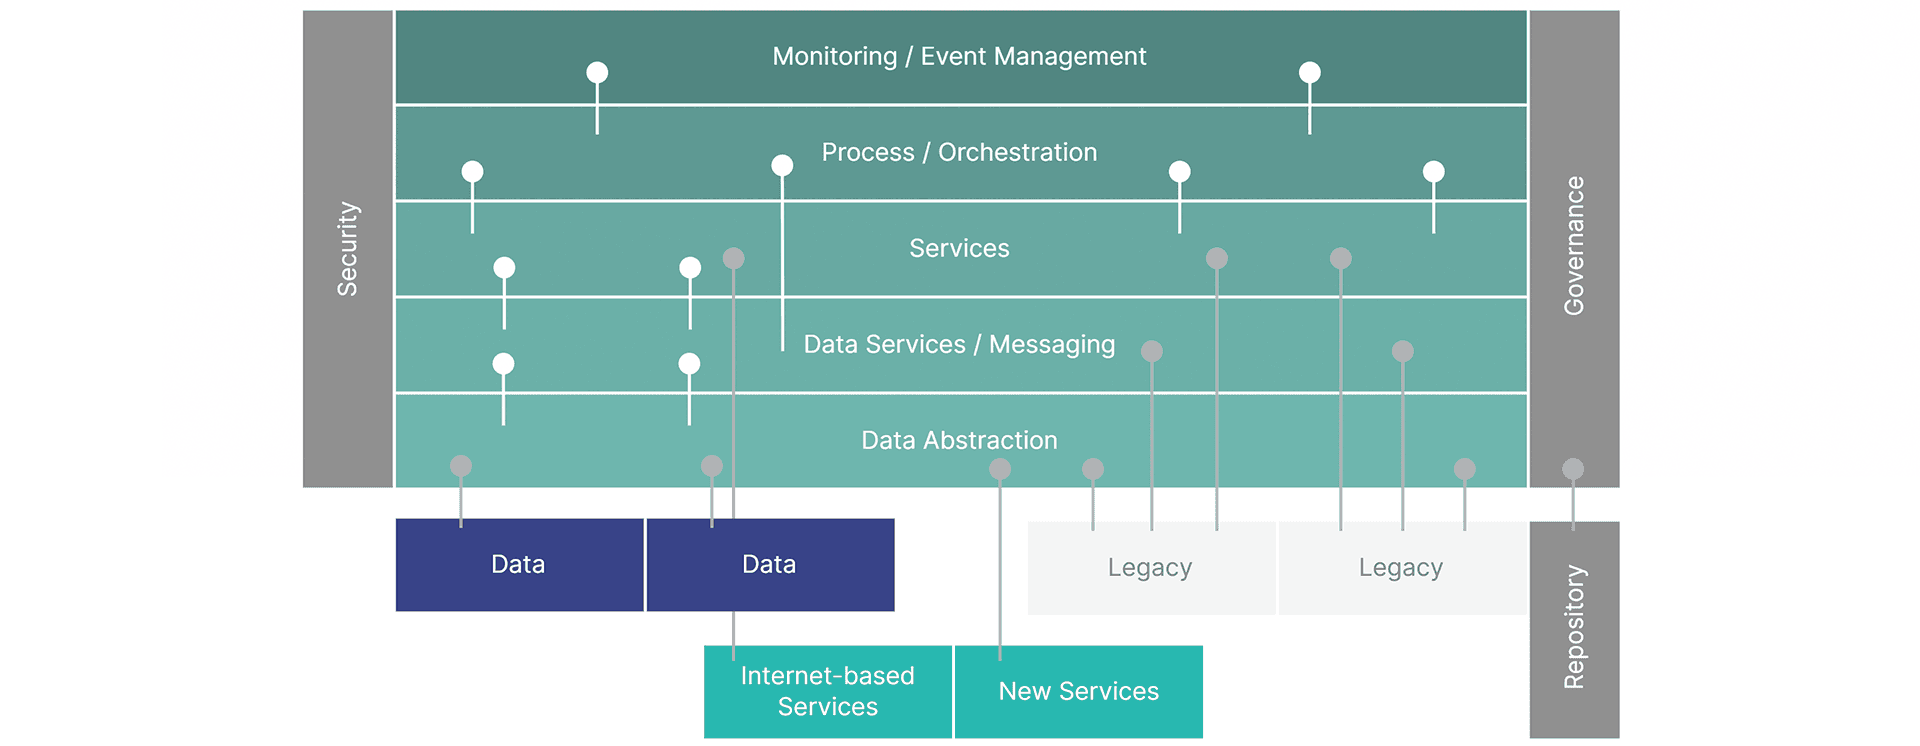
Fig. 1. SOA – Service Oriented Architecture adapted from Wikipedia

For simplicity, we assume that our application is already in the cloud, like in Azure. Some examples are .NET-based, but the idea still applies to other frameworks.

When speaking about scalability, we usually consider two different flavors of it:

  1. Vertical scaling is when we increase the capacity of the “hardware” resources (e.g., more CPU time, faster memory bitrate). Plus, as we are discussing the performance, we briefly cover the optimization topic too.

  2. Horizontal scaling (which also includes Geo-redundancy) is when the number of instances of a particular service increases.

From the two of them, horizontal scaling is more difficult. The reason? In most cases, we cannot scale the entire application because of the need for some synchronizations and cost savings. Instead, we want to extract some particular process into a separate service and scale it independently. This approach also speeds up the service recovery after a failure, which means less chance of an outage for our users. But how do we find the process that is working too slowly?

Finding the right process to extract for scaling

We usually come into question of scaling due to poor performance of particular processes in the system. This may happen with the increase of the complexity of those processes or the increase of the number of users requesting them at a time. Both result in more requests coming into critical-like sections (which is, roughly, a blocking resource with possible access by only one tenant at a time). In this case, the requests are put into the wait queue more often, thus adding overall average response time – in other words a bottleneck.

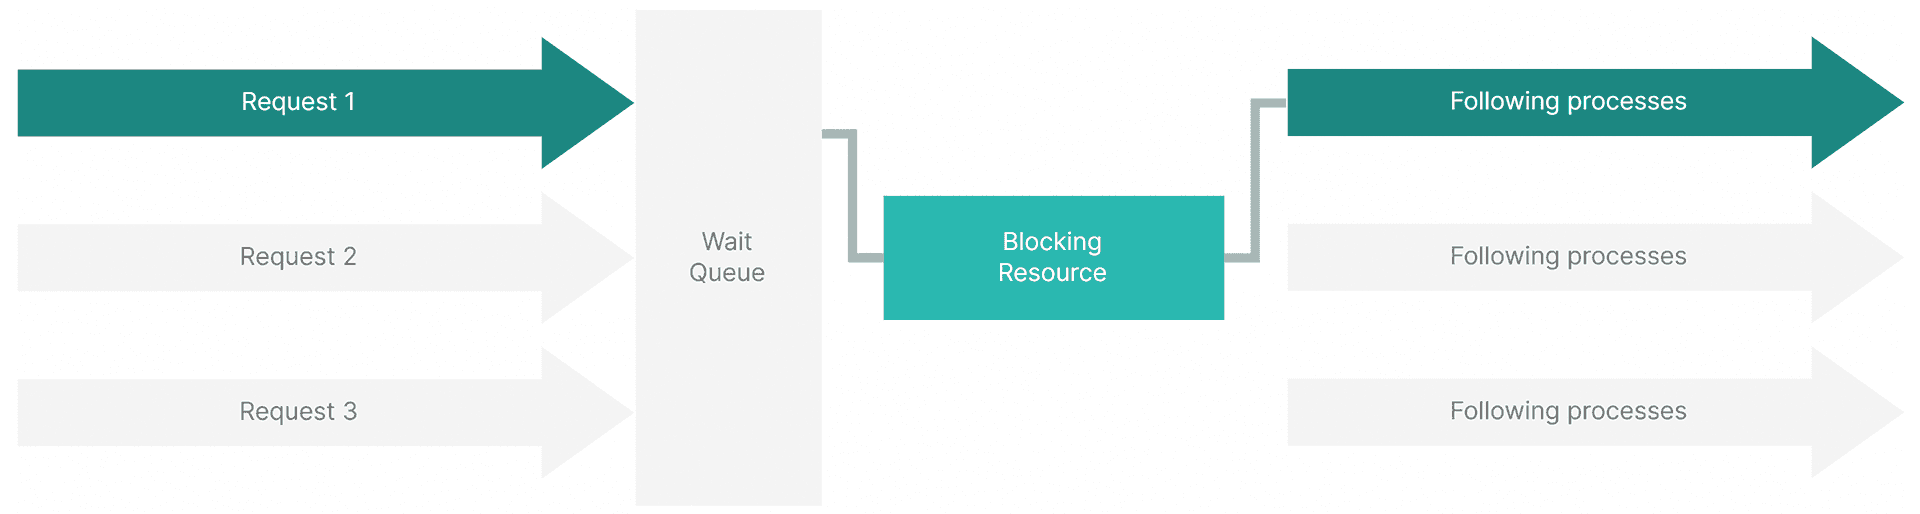
Fig. 2. Only the first request can access a Blocking Resource. Other requests are in the wait queue, while Following Processes have the capacity to serve more requests.
There are simple cases, like when such a resource is just a thread which can be addressed with the increase in the number of CPU cores. But there are more complex cases, like blocking access to a database, which requires global architectural changes. For example, instead of having only one database, we could create one for each tenant and make the code access data asynchronously.
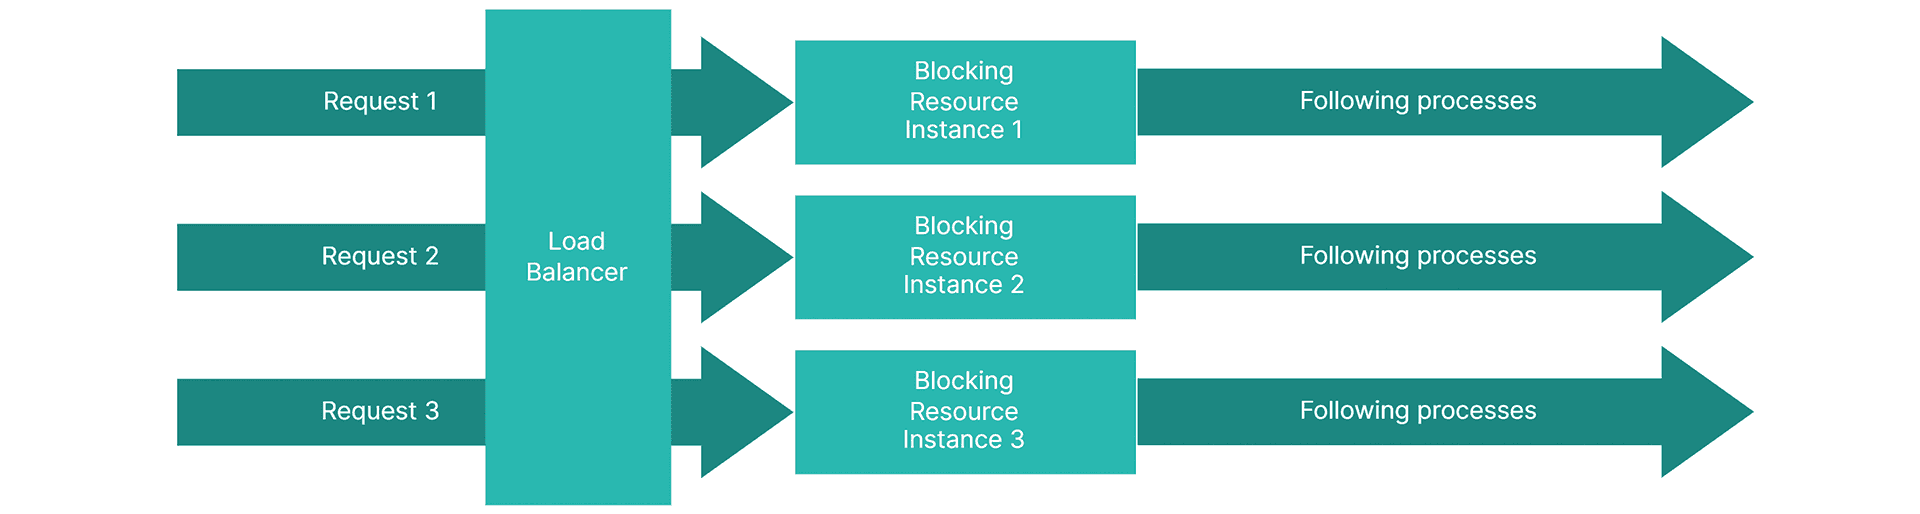
Fig. 3. Blocking Resource is scaled and each request can access its own copy

When tenants are spread geographically, we want to define one or several services for each database (to have them geographically closer to the user – please see Database sharding).

In these cases, the bottlenecks and the queues can come into play with various combinations and are possibly not simple to trace. Let’s see how telemetry can help with that.

The main idea is to measure the process start and end times, eventually calculating the duration. We have dedicated tools for that, and we call the output of such measurements a span (or sometimes a trace).
If we had an HTTP/Web application, spans could be observed even in the browser (developer tools in the menu).
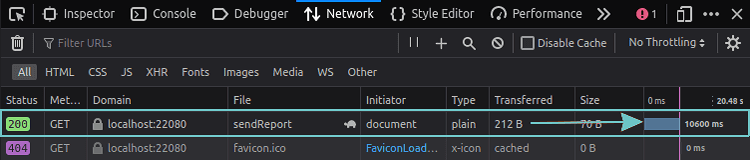
Fig. 4. All major browsers have tracing functionality. Firefox developer tools are shown.

There, we can find the timing that we are not satisfied with, and then for more details we can attach the profiler, which measures all the functions in our application.

Fig. 5. JetBrains dotTrace Profiler (source: JetBrains)
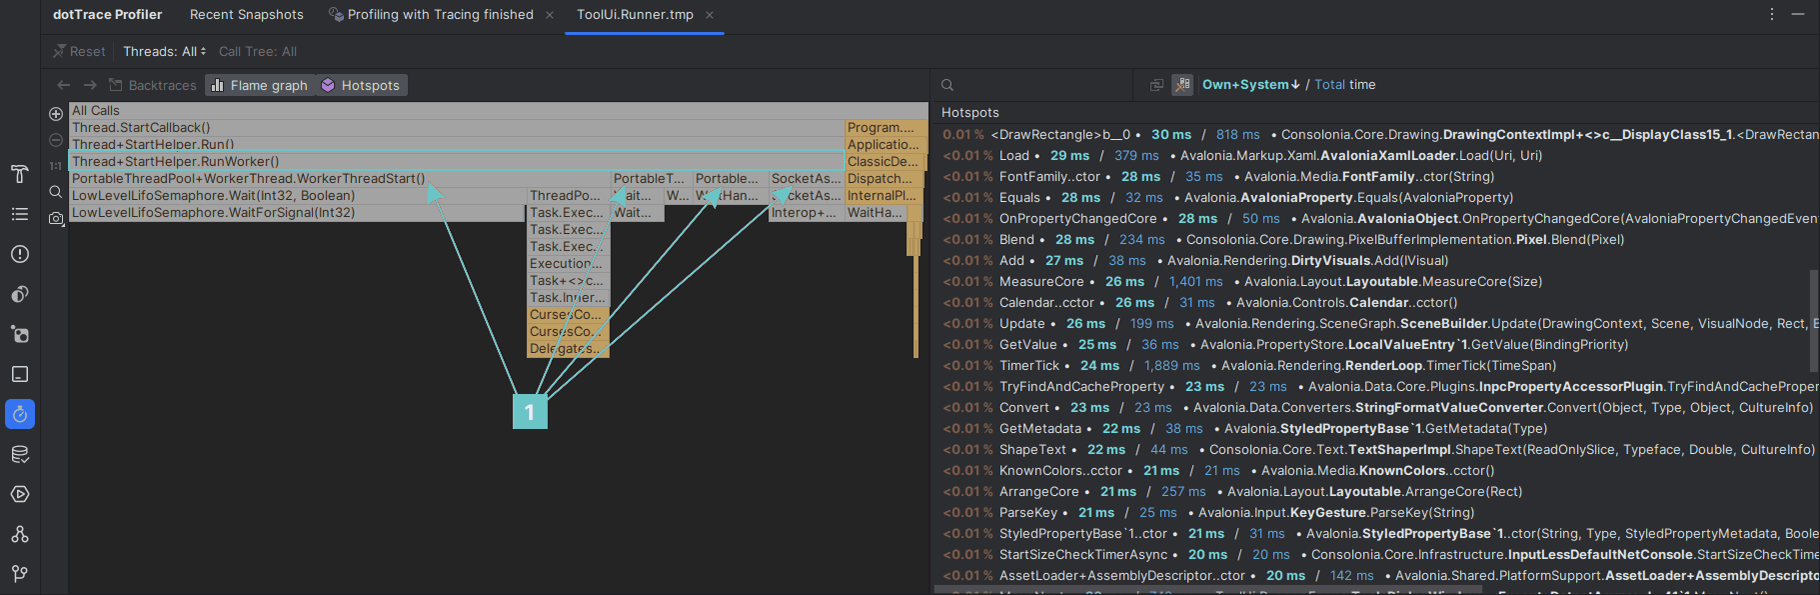
Fig. 5. JetBrains dotTrace Profiler (source: JetBrains Profiler)

Profiler visualizes the slowest spans for us and also spans which they consist of. We can see exactly how much time was spent on each function.

Here, we can also examine the optimizations of the code itself. Something can easily get fixed by resolving programming mistakes. Something can be removed by introducing caching or indexes, or we can try to convert the function to asynchronous code or, oppositely, to synchronous one where necessary.

At this point, it’s also possible to spot the complexity of our algorithms that is too high. Special sampling mode shows us both the time taken and the number of calls.

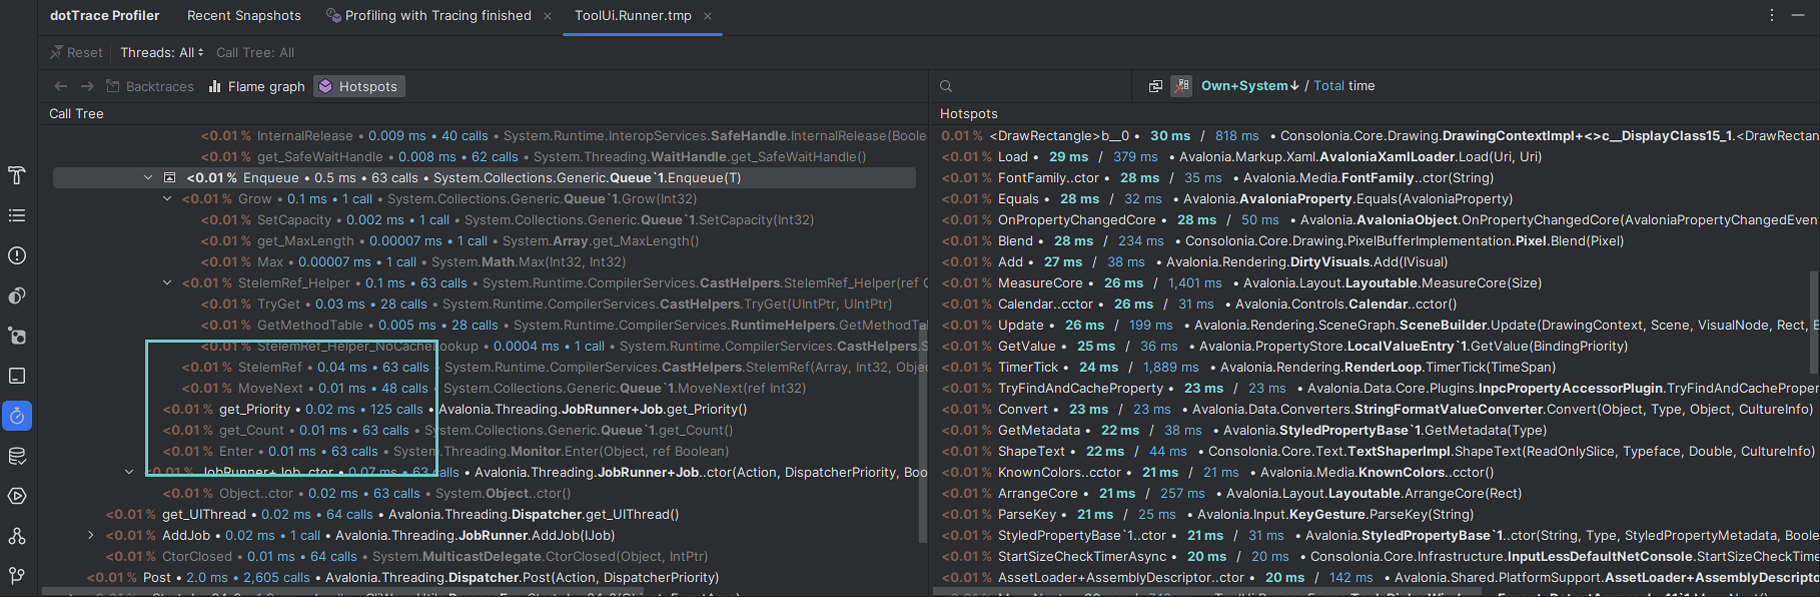
Fig. 6. Sampling mode in JetBrains dotTrace
Most of the profilers also have a feature called Timeline and it is ideal to see how threads are waiting for other threads to do a job.

Additionally, not as much spoken, we can also profile the memory consumption. Memory profiling not only gives the understanding of how to increase the speed, but also it is an argument to scale itself. For .NET, please check dotMemory by JetBrains or similar tools.

These profiler features open the bigger picture on performance. However, it can be very different from the production stages of the application. Users may be invoking different processes more or less frequently than tested. Luckily, we have a number of tools to see traces in the production, and some even allow us to observe the system in real time.

What tools? Let’s start with Azure. Actually, let this knowledge sink in for a bit and then come back for Part 2 of this article.


We hope part one of this two-part article has helped you get the first insights into using telemetry in scaling in the cloud. If you’re looking to dive deeper into the matter, look no further. You’re welcome to get in touch with us and take the conversation forward together.