Telemetry: a big opportunity to approach scaling in the cloud – Part 2
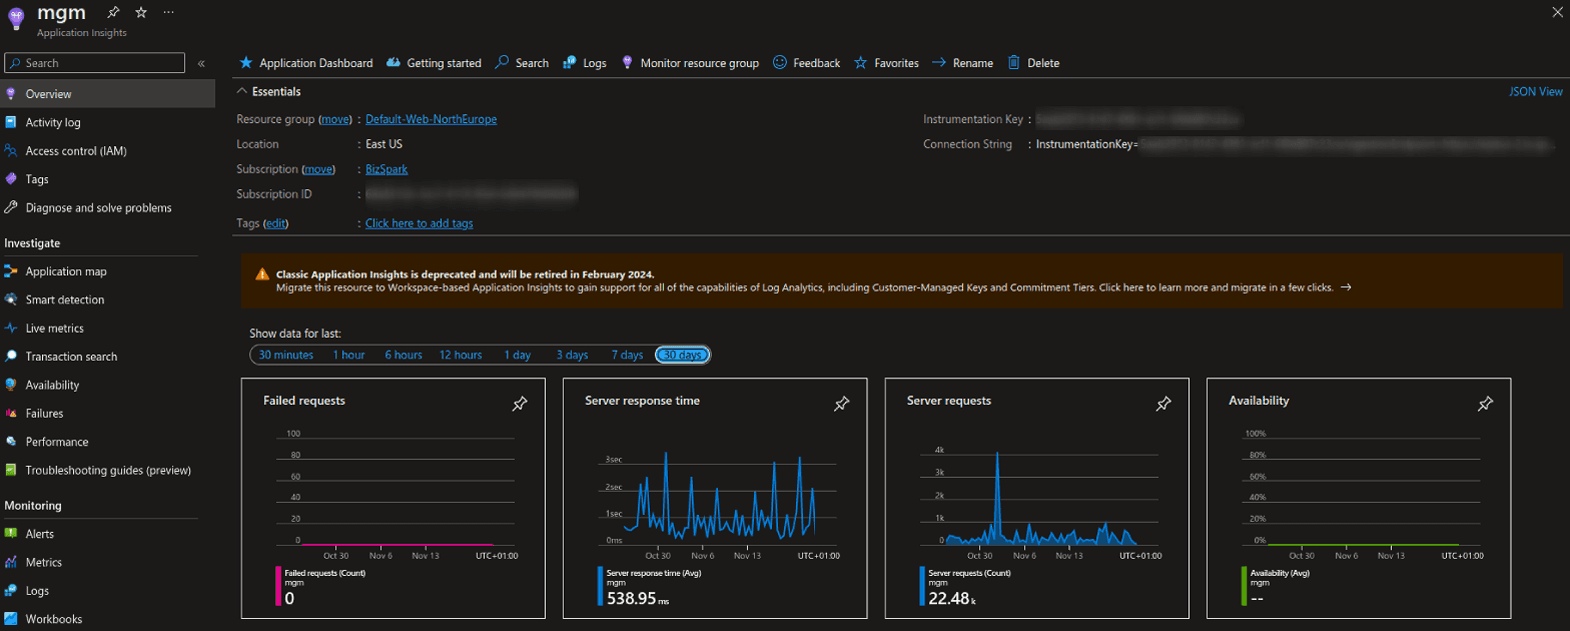
Fig. 7. Default page in Azure Application Insights
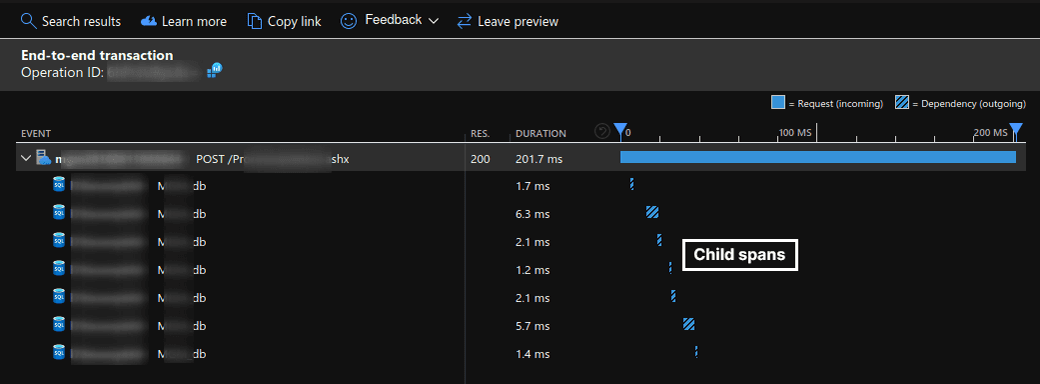
Fig. 8. Span with many attached child spans
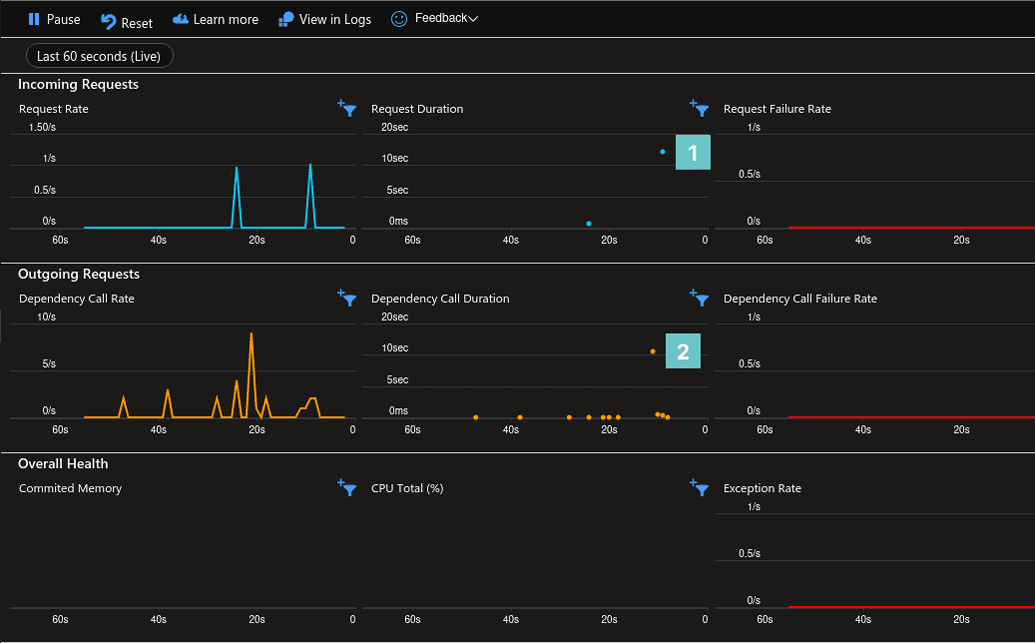
Fig. 9. One of the dashboards of the Application Insights service in Azure
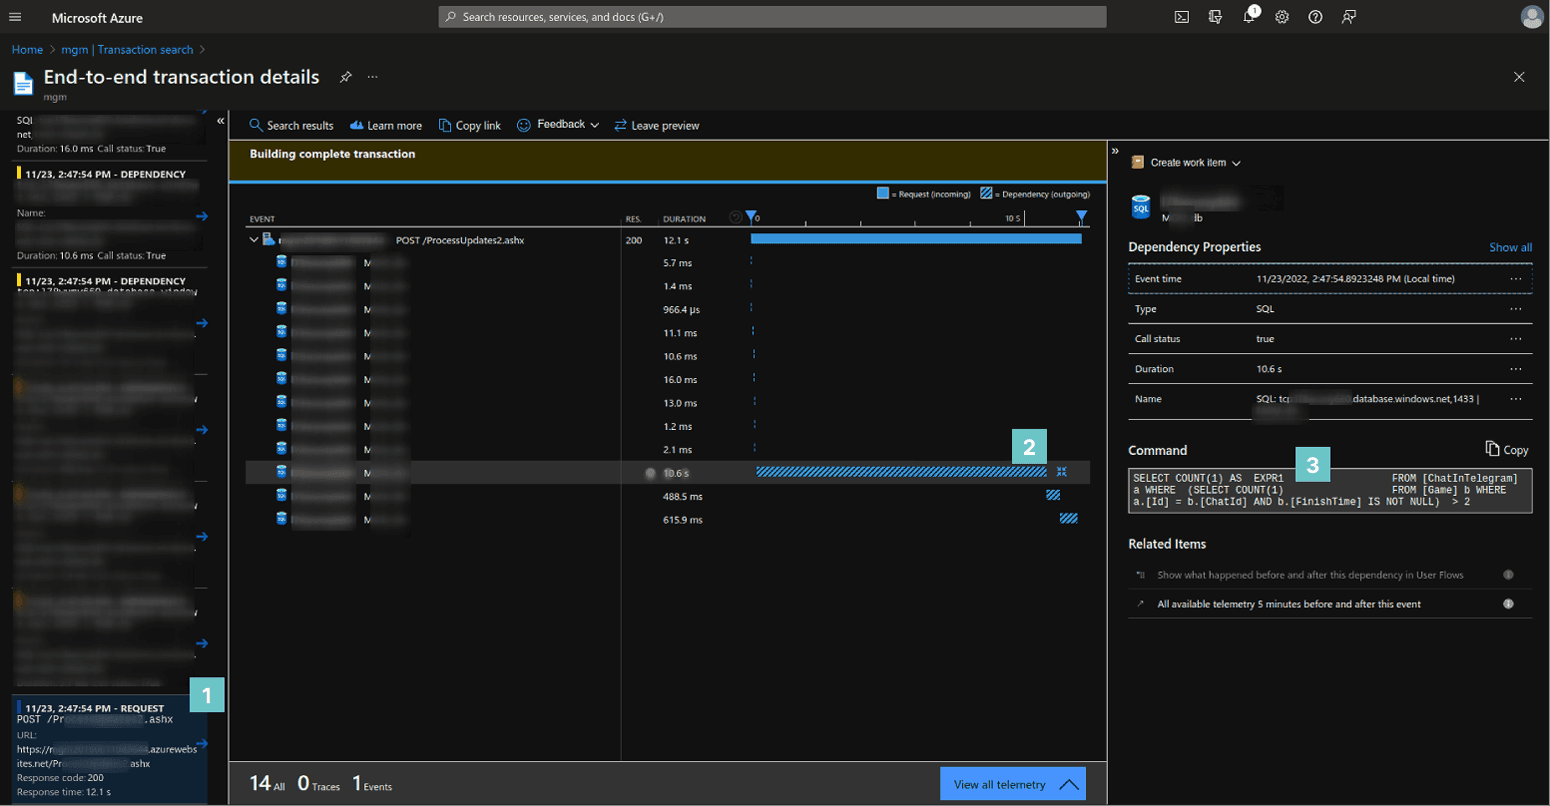
Fig. 10. AI can show separate spans relation between them and details
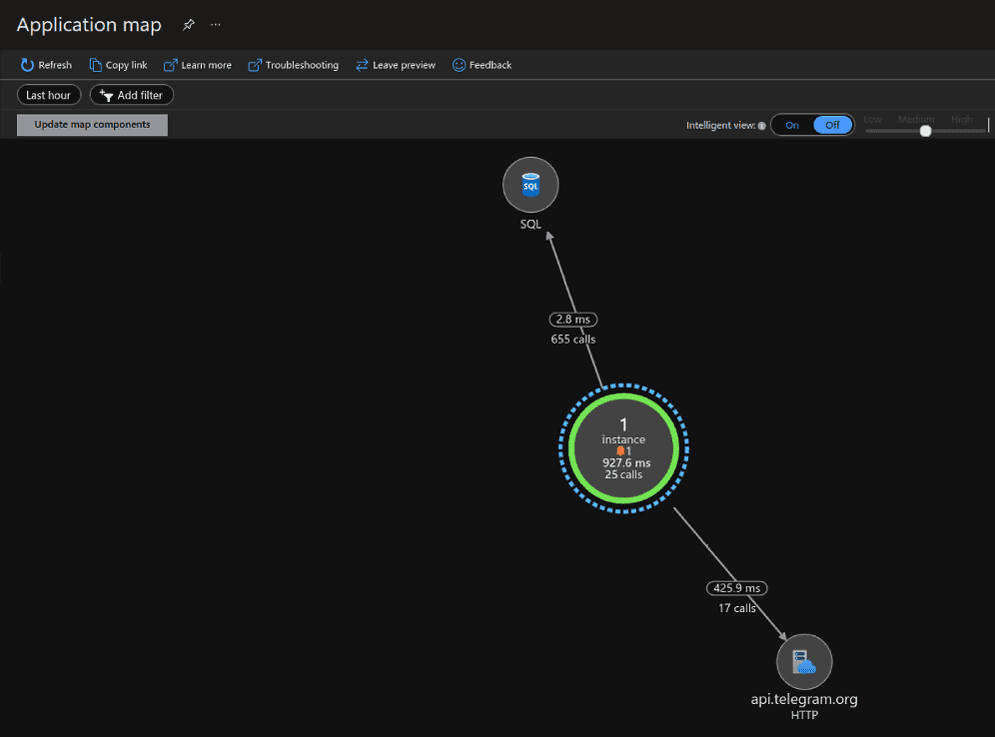
Fig. 11. Application Map in Azure Application Insights
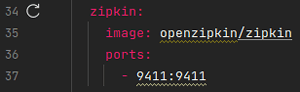
Fig. 12. Zipkin added to Docker-compose configuration
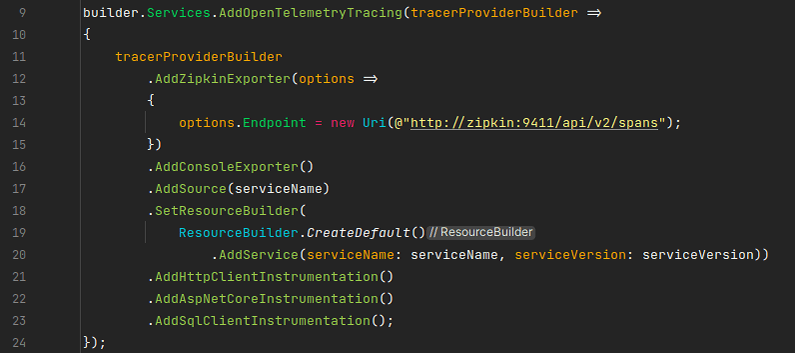
Fig. 13. Application manual instrumentation with OpenTelemetry
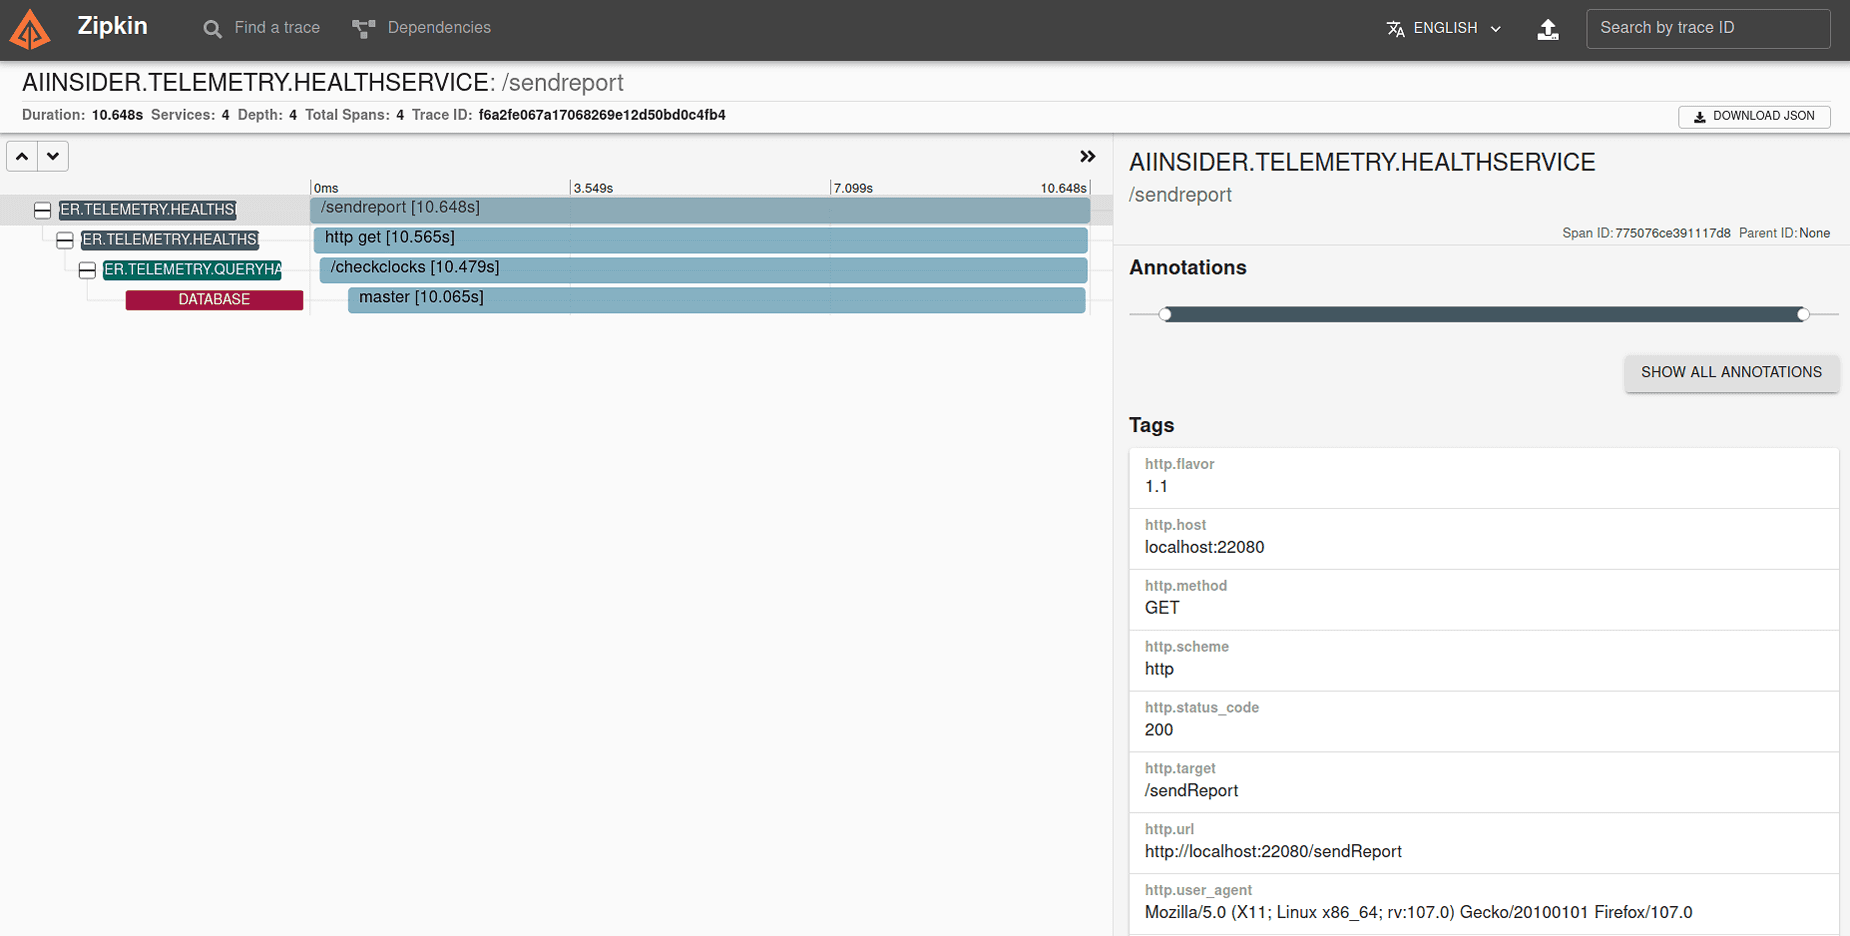
Fig 14. Zipkin data visualization
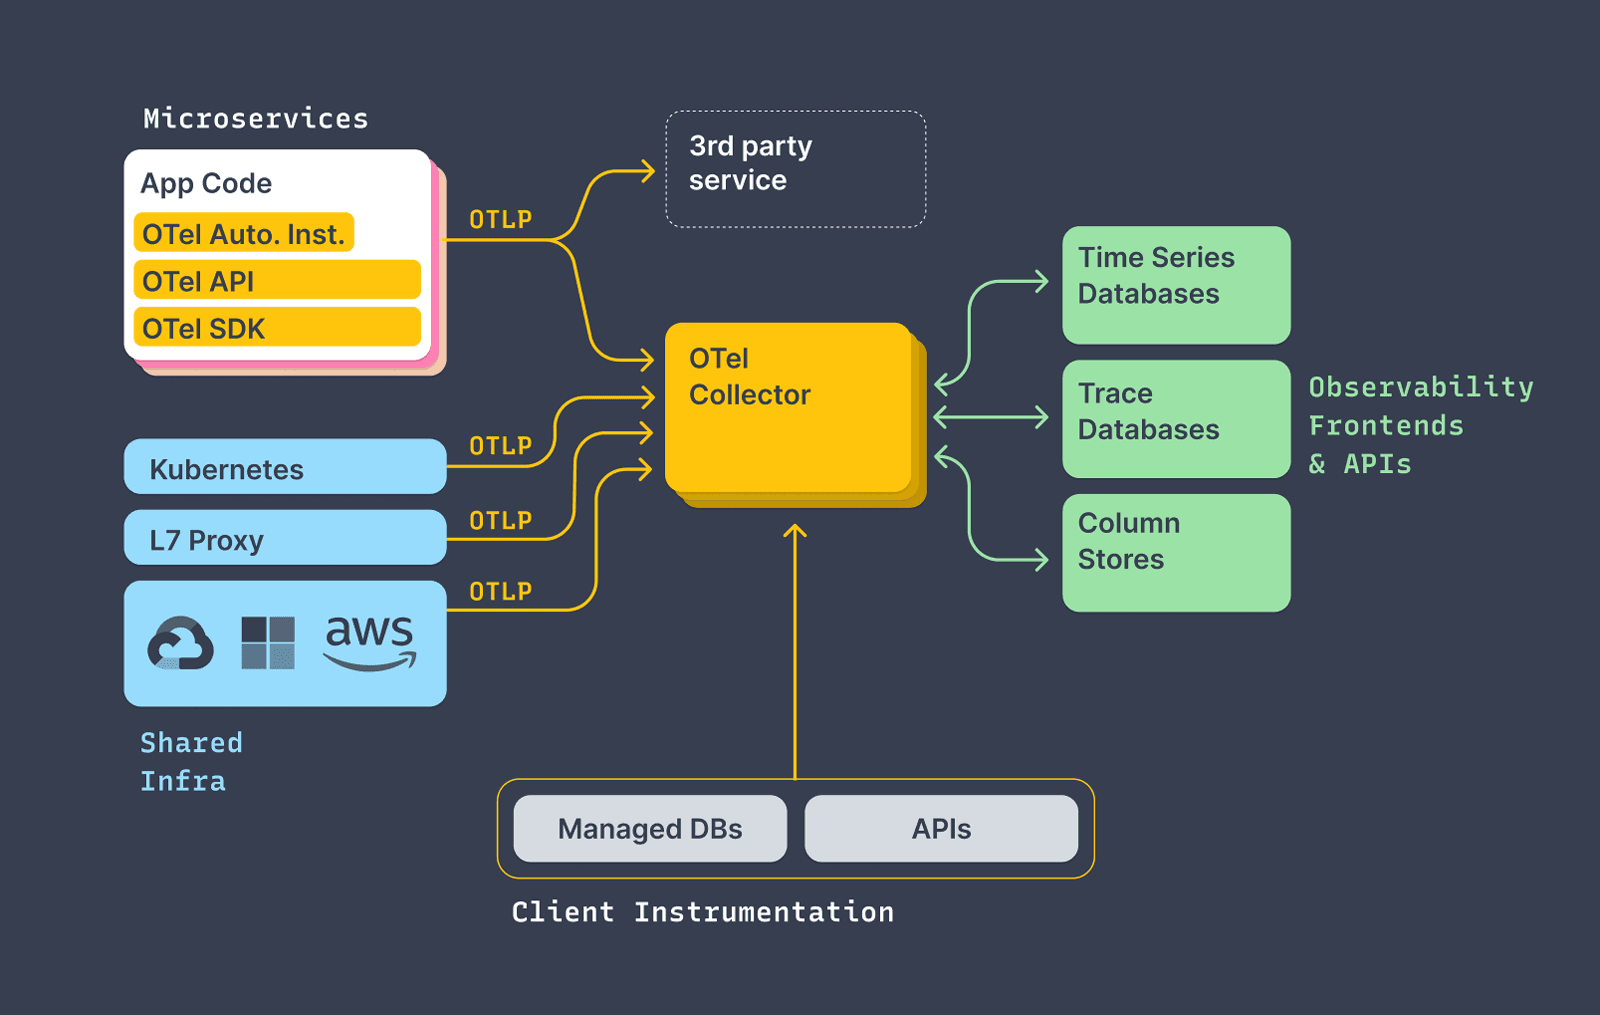
Fig. 13. Application manual instrumentation with OpenTelemetry